
After (roughly) 392 nautical miles miles of sailing, halfway down the US East Coast, the deepest we have been in has been in the first few minutes of the trip. Who-da-thunk?
What am I talking about? After considerable effort, I have my navigation instruments talking to my laptop. We have two mac’s, and the only real choices are MacENC and Polarview. I have been testing both (future post).
 Both programs will record a “track” of where you have been. The track contains data like heading, speed etc etc. It can then be downloaded as a KML file (for things like google maps) or CSV.
You can see the google map of our track so far here.
You can have some math-nerd-fun with the data too. Here are a few graphs I made from the data.

This first graph is a frequency bar chart of the depths that MacENC tracked since leaving Lake Champlain. One thing we have been constantly surprised about (and often annoyed as we run aground… again…) is how fricking shallow everything is. You can see the vast majority of the time we have been under 20′. Almost all of the Delaware and Chesapeake Bays are this depth or less. With a 7′ draft it’s been pretty annoying. Our count of running aground is up to about six. Ironically, all the depths over 100′ you see were all in the first day of our trip in Lake Champlain!

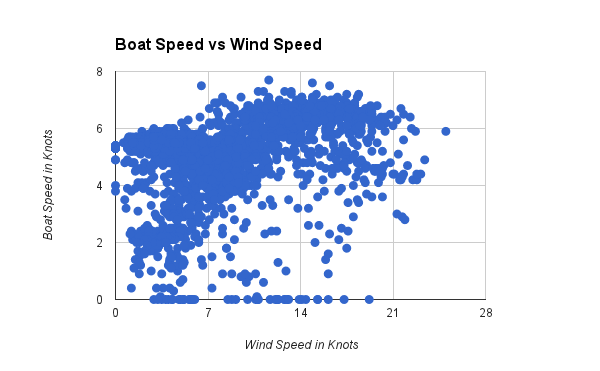
This next graph is potentially interesting, but needs some work. Its an XY Scatter plot of our boat speed (not SOG) at various wind speeds. Unfortunately, it mixes times when we are motoring and sailing. Probably 80% of the time (those darn canals) we have been motoring. You can see this with the band of points around 6 knots, what we usually chug along at. Especially suspicious as we are doing 6 knots when the wind speed is under 5 :).
Above 10 knots we have been probably sailing. If you look closely, you can see a slight arc in the data peaking around 14-15 knots. I think that’s where we have been putting in our first reefs, and there has been a corresponding dip in speed.
I plan to figure out how to collect sail-only and motor-only track data to separate this out.
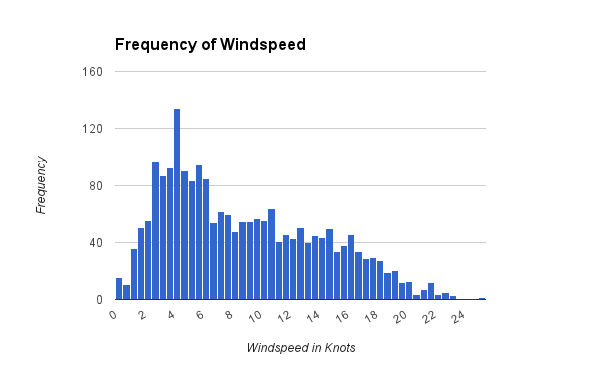
While we are at it, here is what wind speeds we have encountered. A few above 20 knots – rawr!
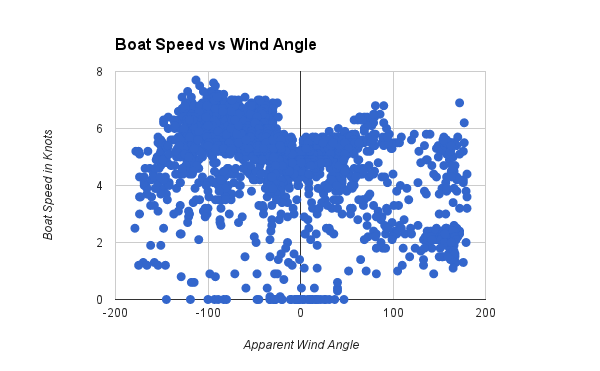
Our last graph has some real benefit once I start removing the motoring data. Its plotting apparent wind angle against boat speed. You might have polars for you boat, we do, but it’s also nice to have some actual hard data of what angle of wind you can go the fastest against.
One last frustration is that for almost all of this 392 miles, I have been hand steering. Our Nexus autopilot died, and stopped getting any heading data. We have had a couple of techs look at it, but still haven’t really got much of a solution. Hopefully we can get is fixed during the boat show in Annapolis. It will be interesting to add heading data to our math projects, not to mention being able to take a break from steering!
PS
If any instrument manufacturers are interested in sponsoring us, we welcome your inquiry!
